![]()
Performance Benchmark Tests of Microsoft and NetScape Web Servers
Responding to HTML, API, and CGI Requests and Running on Windows NT
February 1996
Version 1.0
Executive Summary
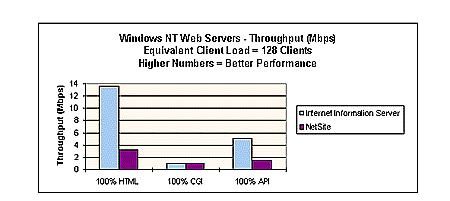
This testing demonstrates that the Microsoft Internet Information Server (IIS) overwhelmingly outperforms the Windows NT version of the NetScape NetSite server when both are running straight HTML. The Internet Information Server substantially outperforms the NetScape server when each server is running its respective proprietary API. (See Figures 1 and 2 below for comparisons of throughput and connections per second.) The Microsoft performance advantage increases consistently as the number of clients making requests increases.
As should be expected, server performance is virtually equal when 100% of requests are for standard CGI. In the case of 100% CGI, both servers are spending the majority of their time running the identical CGI code. The Internet Information Server proprietary API (ISAPI) is roughly five times as fast as CGI while the NetSite API (NSAPI) is roughly twice as fast as CGI.

Figure 1

Figure 2
Even when the Internet Information Server is handling many more requests than NetSite, the Average Response Time for IIS to handle each request is approximately one quarter that of NetSite for straight HTML and one third as great for 100% API requests.

Figure 3
The error rates for both servers were zero in all straight HTML and proprietary API tests. NetScape had errors in some CGI tests while Microsoft had no errors.
The network did not constrain performance in any of the tests. The tests were run over a 100 megabit network and the NT Performance Monitor reported that network utilization never exceeded 16%.
Where Web site managers running Windows NT wish to minimize hardware costs, allow a comfortable margin for peak loads, and provide the maximum room for growth, they will find the Microsoft Internet Information Server superior to the NetScape NetSite server in achieving these goals.
Test Philosophy and Methodology
The benchmark tests used the WebStone release version 1.1 server benchmark to measure the differences in Web server software performance across workloads that exercised HTML, CGI, and API scripts on the servers. The tests used WebStone to measure throughput, connections per second, error rate, and response time (also referred to as latency). CPU utilization and network utilization were simultaneously measured for the same test runs using the Windows NT Performance Monitor.
WebStone is widely recognized to be the current industry standard for measuring Web server performance. It runs exclusively on clients, makes all measurements from the point of view of the clients, and is independent of the server software. Thus WebStone is suitable for testing the performance of any and all Web servers, regardless of architecture, and for testing all combinations of Web server, operating system, network operating system, and hardware. It was developed by Silicon Graphics and is freely available to anyone on the SGI Web server.
The WebStone software, controlled by a program called WebMASTER, runs on one of the client workstations but uses no test network or server resources while the test is running and places only a minimal burden on each client.
Each WebStone client is able to launch a number of children (called "Webchildren"), depending on how the system load is configured. Each of the Webchildren simulates a Web client and requests information from the server based on a configured file load. The tests conducted for this report used four workstations to run the client software. Each workstation simulated the same number of clients with an identical set of requests coming from each workstation.
The tests for straight HTML performance were all run using the same request load (100% identical requests for a small HTML file) and using eight different client loads (16, 32, 48, 64, 80, 96, 112, and 128 clients). The requests were generated from the filelist.ss file which is incorporated within WebStone.
The API and CGI tests were run at three request loads (light, medium, and heavy) for each of the eight client configurations. The load points mixed the proportion of client requests between dynamic HTML requests (requiring a call to a CGI or API routine) and static requests for a HTML document as shown in the table that is shown below:
| Proportion of Client Requests | ||||
|---|---|---|---|---|
| HTML | CGI or NSAPI | |||
| Light | 75% | 25% | ||
| Medium | 58% | 42% | ||
| Heavy | 0% | 100% | ||
The files which generate these proportions of static and dynamic requests are incorporated into the WebStone release 1.1 software under the following names:
filelist.dynamic-light
filelist dynamic-medium
filelist.dynamic-heavy
In some cases it was necessary to make minor modifications to the files to accommodate the proprietary nature of the APIs but the contents of the files (the requests themselves) were the same for all servers.
WebStone was set up to run all tests for a given server at a given load point back-to-back, without human intervention. WebStone stepped the number of clients through the eight pre-set levels, running the test at each level for five minutes and reporting the results of each test to a file at the end of the test run. Selected tests run with heavy request loads and 128 clients were run three times to assure the reproducibility of the results. Results of these repeated tests varied by no more than a few percent.
Log files were cleared and the Web server that was under test at that time was restarted after each test as each request load level was completed.
Test Configuration
The Web servers tested were the Microsoft Internet Information Server Version 3.51 release candidate and the NetScape NetSite Communications Server 1.12.
All Web servers tested were run on the same identically configured:
Hewlett-Packard NetServer LS servers:
At Microsoft's direction, the Listen Backlog parameter in Windows NT was changed to 150 from the default of 16 when run in conjunction with the Internet Information Server. We understand that this parameter has no relevance to NetSite. Based on earlier discussions with NetScape the minimum number of processes in Windows NT was changed from 16 to 32 and the maximum was changed from 32 to 64 to optimize performance.
Since all Web servers accessed the same test files and the files were cached in memory, possible fragmentation of the files on the server disk was not a factor in the results.
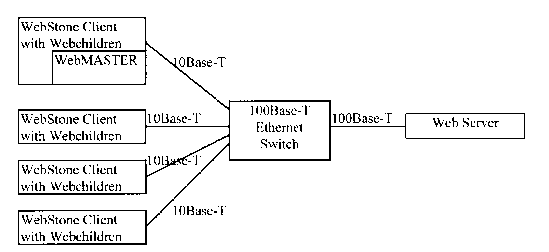
WebStone clients ran on four Silicon Graphics (SGI) Indy workstations with 32 megabytes of RAM running SGI IRIX Release 5.3. The workstations ran on a MIPS R4600 processor at 100 MHz. Each workstation was connected to a WaveSwitch 100 Fast Ethernet switch using the workstation's internal 10Base-T adapter. The server was connected to the switch using a DEC PCI Fast Ethernet adapter running at 100 megabits per second. (See Figure 4.)

Figure 4 Test LAN
Test Results
Each of the following tables presents the results of testing HTML, CGI, or API requests at a specific load point (light, medium, or heavy) and shows how the measurement varied with the number of clients.
Table 1A Average Throughput (Megabits/Sec) for HTML and CGI
Table 1B Average Throughput (Megabits/Sec) for Proprietary APIs
(The content of the following tables will be added before the final draft of the report.)
Table 2A & 2B Connections per Second
Table 2A Average Connections per Second for HTML and CGI
Table 2B Connections per Second for Proprietary APIs
Table 3A & 3B Errors per Second
Table 3A Average Response Time for HTML and CGI (Seconds)
Table 3B Average Response Time for Proprietary APIs (Seconds)
Table 4 Response Time
Table 4 Error Rate for CGI (Errors per Second)
(No errors were reported for either server while running HTML
or proprietary APIs.)
Table 5A & 5B CPU Utilization
Table 5A CPU Utilization for HTML and CGI (Percent)
Table 5B CPU Utilization for Proprietary APIs (Percent)
Table 6A & 6B Network Utilization
Table 6A Network Utilization for HTML and CGI (Percent)
Table 6B Network Utilization for Proprietary APIs (Percent)
Testing and Report Certification
This report is written by Shiloh Consulting and Haynes & Company based upon testing which they conducted between January 24 and February 6, 1996 at the offices of Shiloh Consulting. The testers believe that the relative performance of the tested Web servers is projectable to real world environments-where the specific client requests made, the demand on the server and the network, and the number of clients vary over time.
Shiloh Consulting is an independent network consulting company. Shiloh is led by Robert Buchanan who has over twenty years experience in product development and testing for ROLM Corporation and 3Com Corporation. From 1990 to 1994, Mr. Buchanan ran the testing and operations of LANQuest, a leading network product testing laboratory. Recently he completed a new book, The Art-of-Testing Network Systems, which will be published by John Wiley & Sons in April, 1996.
Haynes & Company (://www.haynes.com) provides business planning and program management for high tech companies. Past clients include Oracle, Qualcomm, 3Com, Interlink Computer Sciences, Artisoft, and NetScape. Ted Haynes of Haynes & Company was a contemporary of Bob Buchanan at both ROLM and 3Com. He is the author of The Electronic Commerce Dictionary and has spoken on commerce over the Internet at the RSA Data Security Conference.
Every effort has been made to insure that the results described are fair and accurate. This report may be reproduced and distributed, as long as no part of this report is omitted or altered. All trademarks in this report are the property of their respective companies.